High-volume news queries get fewer Google AI Overviews
On 2,998 queries per country, Google's AI answer rate falls from 54.8% under 100 monthly searches to 12.8% above 10,000 in France, 11.6% in the UK.
Par Gilles Helleu
The gist in 4 lines: on 2,998 distinct queries on news topics per country measured every day from 19 to 25 August 2026, Google shows an AI Overview on 50.9% of queries in France and 57.9% in the UK. But the rate falls steadily as search volume rises: 54.8% under 100 monthly searches, 12.8% above 10,000 in France, 64.7% and 11.6% in the UK. Weighted by search volume, the rate drops to 17.6% and 13.6%. And a quarter of queries change status at least once within the week.
Where these figures come from
This article is a satellite of our study Study: on the news, Google's AI cites social media before the press. Two frozen panels of 2,998 distinct queries on news topics, one panel for France and one for the UK, built from topics actually in the news (people, events, cases, works, companies). The panels are drawn from demand, not from the media: the topics are the most viewed Wikipedia pages in each country from 5 to 18 August 2026, compared with their July audience, then matched with the queries actually typed into Google and their volumes through DataForSEO Labs, with a draw stratified by theme and by volume band. These are therefore queries on topics that made the news, not breaking-news queries in the strict sense (86 French and 77 British queries carry an explicit news marker). Since the panel is derived from Wikipedia entities, Wikipedia's place among cited sources is partly a construction effect. Each query carries a theme, a register (biographical, factual, news, practical, detected by keywords in the query) and a monthly search volume. Every query was submitted daily around 15:00 UTC to Google France and Google UK, at country level, on desktop, through DataForSEO's SERP API with AI Overviews loaded: 2,998 distinct queries per country (the 3,000-query draw contains two duplicates), 41,971 records over seven days.
All rates come with a 95% confidence interval. Daily rates use the Wilson interval; seven-day averages are computed per query and then bootstrapped over queries, so a query is never counted as seven independent observations. The data files are on the study page.
1. The more a query is searched, the less Google answers with AI
This is the most counter-intuitive result of the study. Split the panels by monthly search volume and the AI Overview rate goes down at every step, in both countries.
| Monthly search volume | France | UK |
|---|---|---|
| Under 100 | 54.8% | 64.7% |
| 100 to 999 | 52.8% | 55.2% |
| 1,000 to 9,999 | 40.9% | 45.7% |
| 10,000 and above | 12.8% | 11.6% |
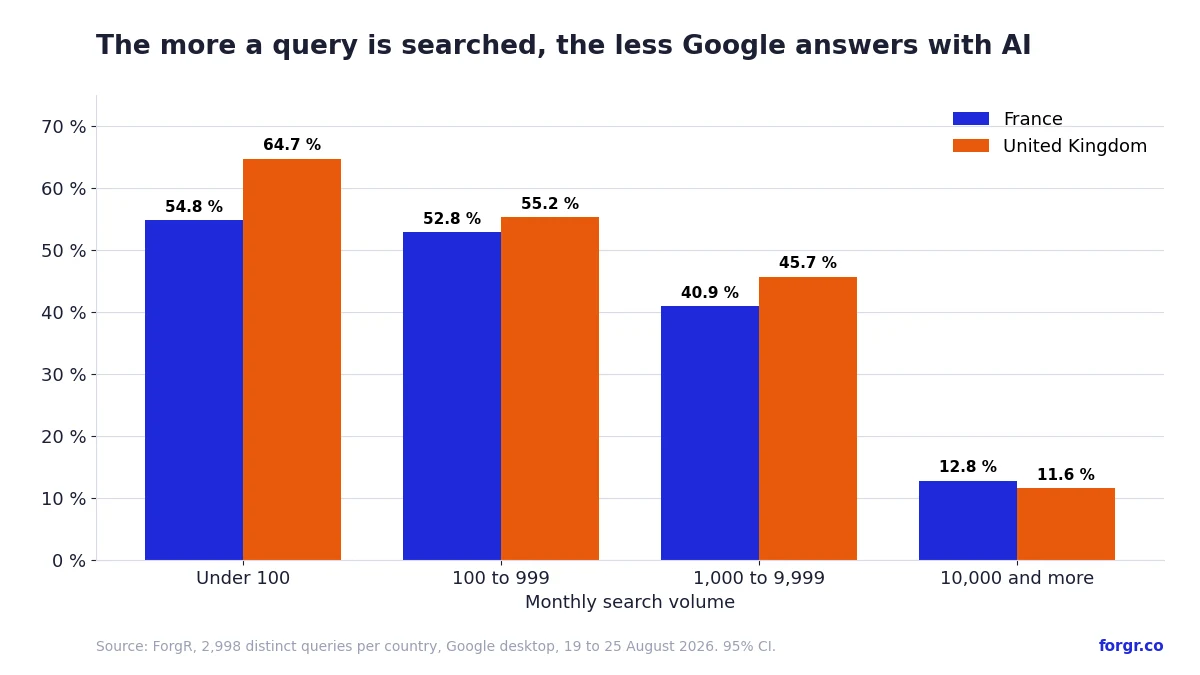
The bands are not equal in size. The under-100 band holds 1,541 French queries and 1,671 British ones; the top band holds 87 and 106. That is why the interval on the top band is wide: 12.8% 7.5 ; 18.7 in France, 11.6% 6.1 ; 17.8 in the UK. Even the top of that interval stays far below the bottom of the under-100 band (54.8% 52.5 ; 57.2 and 64.7% 62.5 ; 66.8). The gap is not a sampling accident.
2. Seen from the reader's side, the AI answer is a minority
The 50.9% and 57.9% headline rates count each query once. Readers do not: a query searched 50,000 times a month weighs more than one searched 40 times. Weighting each query by its search volume, the AI Overview rate falls to 17.6% in France 12.7 ; 23.9 and 13.6% in the UK 10.5 ; 17.6.
In other words, on the big queries of hot news, Google shows its news blocks and classic results, not a synthesis. The AI Overview occupies lukewarm news: the name you check, last week's case, the biography of someone in the headlines.
One check on the panel itself. Reweighting by theme to match the real distribution of a news corpus gives 47.9% in France and 57.8% in the UK, close to the raw figures. The panel's structure does not manufacture the result.
3. The register says the same thing
Biographical queries trigger an AI answer in 68.2% of cases in France 64.8 ; 71.7 and 75.6% in the UK 72.3 ; 78.6. Factual queries: 46.3% and 54.4%. A biography has a stable, well-documented answer that Google can compile; a story that is still moving does not. This is consistent with what those answers cite: Wikipedia is the most cited domain in both countries (13.9% of citations in France, 12.0% in the UK).
4. A quarter of queries change status within the week
The rate is not only lower on big queries; it is unstable on all of them. Over seven days:
| France | UK | |
|---|---|---|
| AI Overview every day | 37.2% | 44.2% |
| Never | 38.9% | 32.5% |
| Intermittent | 23.9% | 23.3% |
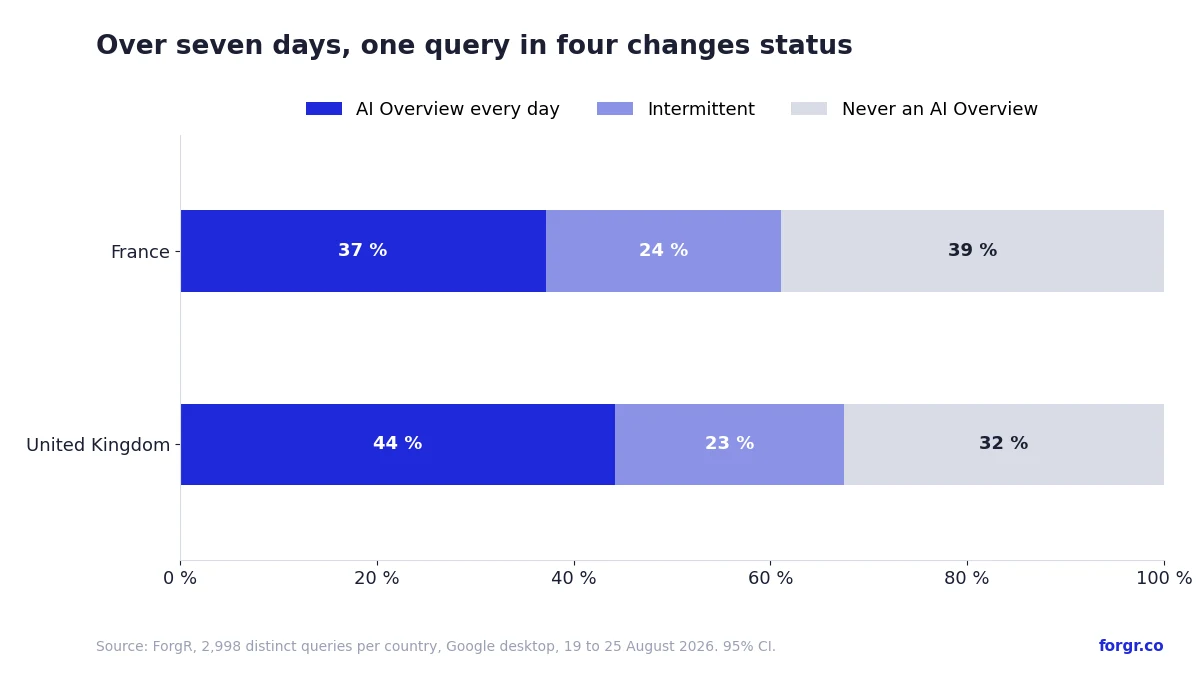
From one day to the next, about 7% of queries flip status (7.3% in France, 7.0% in the UK). And the week itself is not flat. France goes from 49.2% on 19 August to 52.2% on 25 August, with a dip at 46.8% on 20 August; the UK goes from 55.8% to 59.9%. The rate climbs by 3 to 4 points between 19 and 25 August, then levels off in France from the 22nd to the 25th (52.1 / 53.0 / 52.7 / 52.2). Two readings are possible, and our data does not decide between them: Google is extending coverage; or the panel's topics, frozen on 18 August, are cooling down, and Google withdraws Top Stories where the AI Overview takes their place.
The practical consequence: a measurement taken on a single day is off by around three points on the rate, and is simply wrong on a given query one time in four.
What it changes for anyone working on visibility in AI answers
These figures are about news queries, but the mechanics apply to any SME, brand or SEO and GEO lead trying to be cited by Google's AI.
Lukewarm long-tail news is AI Overview territory. If your company, your founder or your product shows up in queries under 1,000 searches a month, more than half of those queries get an AI answer (52.8% to 54.8% in France, 55.2% to 64.7% in the UK). That is where sources get picked, and on news queries Google's AI cites Facebook pages, Instagram accounts and Wikipedia more often than press articles. Your own profiles and your own pages are candidates.
Breaking news stays with classic results and news blocks. Above 10,000 monthly searches, roughly one query in eight gets an AI Overview. On hot topics, ranking in the classic results and in the news carousel is still what counts. Do not reallocate effort on the strength of a headline rate of 50% or 58%: from the reader's side it is 18% and 14%.
A single-day measurement means nothing without a date and a confidence interval. When a tool or a report hands you "AI Overview rate: X% in your sector", ask three questions: which day, how many queries, what interval. In the same week, a single French pass could have read 46.8% or 53.0%. We say this against ourselves too: our study of 1,000 French buying queries on 12 August was a single pass, and its 58.6% rate is a snapshot.
Track your own queries over time. A rate is only useful compared to the previous one, on the same queries, with the same method. The indicators worth following are in our guide on measuring AI visibility.
Limits
Desktop only, at country level with no city, seven consecutive days in August 2026, and the measured week itself shows a three-to-four-point rise whose cause our data does not establish. Volume bands rely on the monthly search volume attached to each query; the top band is small (87 and 106 queries), and its interval is wide. Volume weighting corrects the panels' over-representation of low-volume topics at the cost of a wider interval. Press reference lists are not symmetrical between France and the UK, which matters for the citation figures in the main study but not for the rates presented here. And a citation is not a click: this study measures when Google answers and whom it names, not who gets traffic.
A ForgR study, conducted by Gilles Helleu and Paméla Michel, co-founders. Every figure can be recomputed from the CSV files published under CC BY 4.0 on the study page. Raw per-query records are available to researchers and journalists on request.